


Introduction to Power BI and Tableau
In the world of data visualization and business intelligence, Power BI and Tableau stand out as leading tools. Both platforms allow organizations to analyze data, create impactful visualizations, and ultimately make informed decisions. Understanding their unique features and capabilities can help businesses select the right tool tailored to their needs.
User Interface and Usability
When it comes to user experience, Power BI and Tableau present different approaches. Power BI features a straightforward, user-friendly interface that easily accommodates beginners and seasoned analysts alike. Its integration with Microsoft Office tools enhances familiarity. Conversely, Tableau offers a more sophisticated interface, which provides greater flexibility and customization, yet may require a steeper learning curve for new users.
Usability Comparison
- Power BI is easier for beginners with a familiar interface.
- Tableau offers advanced customization options.
- Power BI integrates seamlessly with Microsoft tools.
- Tableau has a greater depth of analytical features.
Data Connectivity and Integration
Both Power BI and Tableau support various data sources. Power BI shines with its tight integration with Microsoft products, allowing users to connect effortlessly to Excel, Azure, and SQL databases. Tableau has a broader range of connections to diverse data sources including cloud-based and big data technologies, making it a versatile option for organizations with varied data environments.
Data Visualization Capabilities
Visualization is at the heart of both tools, but they excel in different ways. Power BI offers a solid range of standard visuals and is particularly strong in creating interactive dashboards. Tableau, on the other hand, is renowned for its extensive visualization capabilities, allowing for more complex and customized visual representations. Its flexibility is particularly beneficial for data-rich environments requiring detailed insights.
Pricing Structure
Pricing can be a significant factor in choosing between Power BI and Tableau. Power BI generally offers a more affordable solution, with a free version available and a cost-effective Pro version. Tableau, while providing a free trial, tends to be on the pricier side, especially for enterprise licensing. Businesses must carefully consider their budget and expected return on investment.
Pricing Overview
- Power BI has a free tier and lower pricing overall.
- Tableau is more expensive, especially for enterprise licenses.
- Both tools offer trial versions for testing.
Collaboration Features
In today’s digital workspace, collaboration is vital. Power BI excels in integrating with other Microsoft applications, leveraging Microsoft Teams for enhanced collaboration. Tableau offers options for sharing dashboards and insights but may not be as seamlessly integrated with collaboration platforms as Power BI.
Deployment Options
Both Power BI and Tableau provide various deployment options, including on-premise and cloud-based solutions. Power BI predominantly emphasizes the cloud, whereas Tableau offers greater flexibility with robust on-premise capabilities. Organizations need to evaluate their infrastructure and preferences when considering these options.
Final Thoughts: Choosing the Right Tool
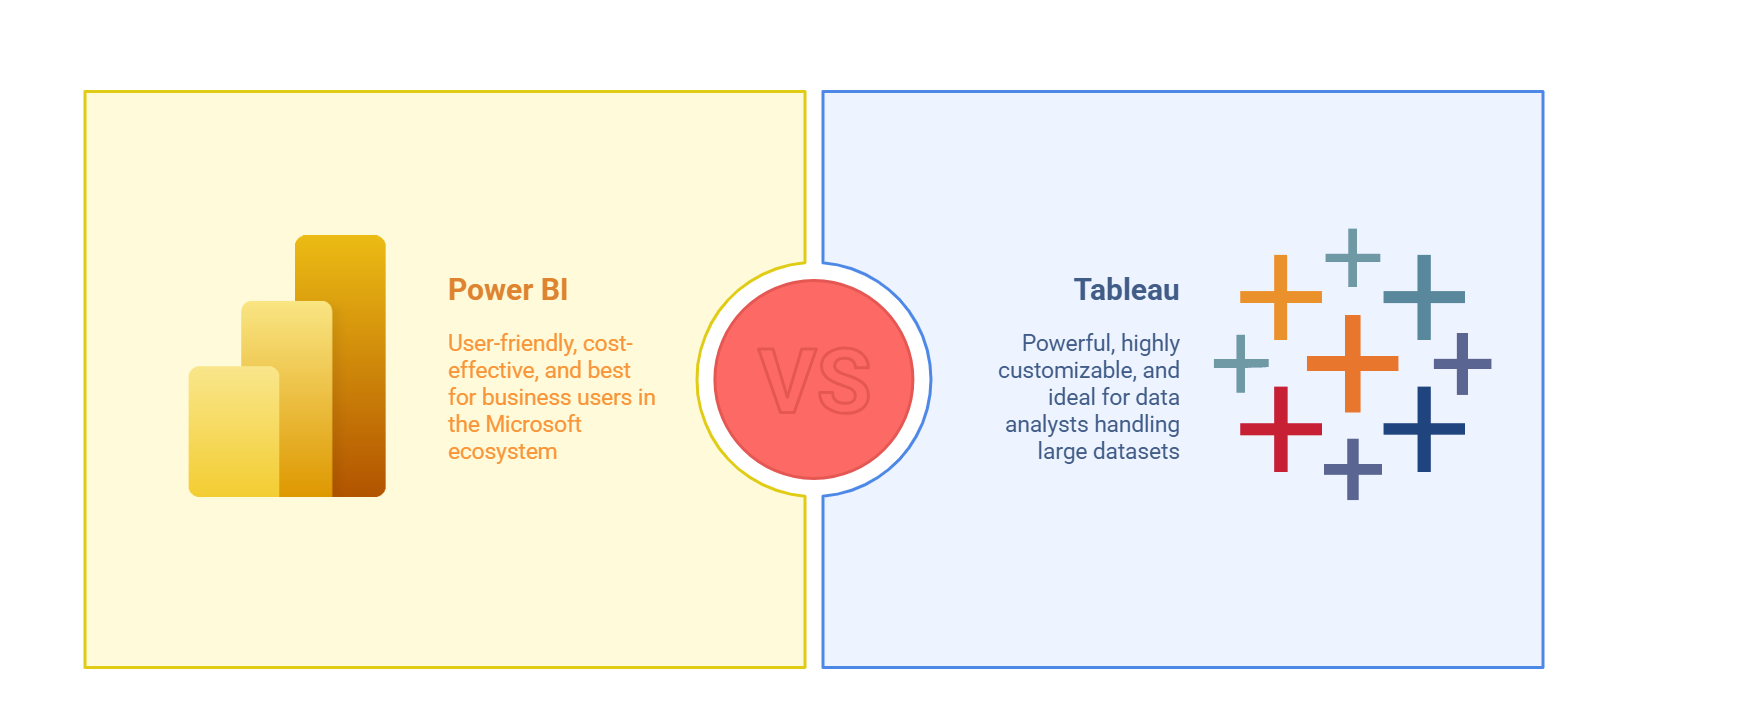
Ultimately, the choice between Power BI and Tableau depends on the unique needs and context of your organization. If you value user-friendliness, integration with Microsoft products, and lower costs, Power BI may be the ideal fit. Conversely, if your focus is on advanced data visualizations and integrations with diverse data sources, Tableau could be the superior option. Whichever you choose, both tools empower businesses to harness the power of data.
Just get in touch with us and we can discuss how ProsperaSoft can contribute in your success
LET’S CREATE REVOLUTIONARY SOLUTIONS, TOGETHER.
Thanks for reaching out! Our Experts will reach out to you shortly.